Get FREE SHIPPING on your next order when you get a Grow Light! 💡


Grow Light Metrics and Specifications

 Photosynthetically Active Radiation vs. Human Vision

Traditionally, lights have been specified by how powerful they appear to the human eye.  The luminous efficiency function quantifies the eye's response across the visual spectra.  It's a bell shaped curve peaking at 555nm.  A light's total luminous flux is specified in lumens which are computed by taking the power spectrum of a light source, multiplying it by the luminous efficiency function and then integrating over the whole spectra. 

However, lumens are not a good metric for photosynthesis since the luminous efficiency function discounts a huge part of the photosynthetic action spectra.  Lights with high lumen output may not be very efficient for photosynthesis and vice versa.  Therefore, a new metric was developed which accounts for the region of photosynthetic active radiation (PAR).  Photosynthetic photon flux (PPF) simply counts the number of photons emitted by a light source in the PAR region between 400nm-700nm.  PPF is specified in units of mols of photons emitted per second (with 6.022 x 10²³ photons per mol).  
Integrating spheres are used for radiometric measurements (PPF, lumens, power spectra, etc) of light sources.  Operation consists of placing a light source inside a sphere with a highly reflective coating then measuring through small observation ports.  Due to the size and cost required for operating integrating spheres, these devices are uncommon except for larger laboratories or high quality manufacturing facilities.  

The efficiency of a light source for photosynthesis is defined as photosynthetic photon efficiency (PPE) and is measured in mol of photons per second per watt of electrical input. For most lighting sources PPE is in the range of μmol/Joule.
Here's a table comparing efficiencies of commonly found grow lights.  For more details on each of these sources, make sure to look at Light Sources.

Grow Light Efficiency Table

Source PPE (umol/J)
Strip Light LED ~0.2
T8 Fluorescent 0.84
Ceramic Metal Halide (CHM) 1-1.5
High Pressure Sodium (HPS) 1-1.72
T5HO Fluorescent 1.23
Shoplight LEDs 1-1.3
LED Retrofit Tubes 1-1.8
Horticultural LED* 1.5-2.7
Florawave FS LED 2.3-2.6
Theoretical LED bounds 5.1

*Reference to major brands that publish specifications.  Many off-brands do not test or publish specs.

Under circumstances where PPF is unknown, many light sources intended for general lighting will specify a light's efficiency as lumens per watt of electrical input.  Again, metrics specified in lumens are evaluated weighing a light source with the luminous efficiency function and this data should be interpreted with caution for photosynthesis applications.
The measurements described above are characteristics of the entire light source.  PPF describes the total number of photons produced by a light source per unit time.  As light propagates from a source, it spreads out over a range of angles.  Above we have a diagram of light spreading from a point source over distance.
Radiant intensity is the distribution of light per solid angle of a source.  This typically has units of either lumens per steradian, watts per steradian or photons per second per steradian. Intensity is measured by recording the light emitted over a controlled range of angles with a device called a goniophotometer. 

Intensity specifications are a pretty technical regime and usually only optical engineers get down to the nitty gritty of this when designing lights.  However, I mention intensity here because it has a very different meaning depending on the type of science or engineering being discussed.  In some fields, like physics, intensity is used in lieu of irradiance.  (This probably popped up in your high school physics textbook.)  When we mention intensity, we're talking about light per solid angle.  When we mention irradiance, we're talking about light per area (see below).
The most critical metric for horticulture is the amount of useful PAR photons delivered per unit time to a particular spot.  This is the metric that plants actually experience and is defined as photosynthetic photon flux density (PPFD) which has units of mols of photons per second per square meter.  PPFD at any given spot depends on distance and angle from the light source.  For example, the maps in illustration above depict PPFD with a 4 foot LED suspended 12" and 24" above a flat surface.  Note how as distance increases, the PPFD spreads and becomes more uniform over a wider illuminated area.  However, the peak PPFD values decrease.
Light sensors measure PPFD by counting photons over the PAR region (400-700nm). Spectrometers and quantum meters are the 2 most common sensors currently used.  Note that an integrated cosine corrector on the device minimizes measurement error by scattering incoming light in such as way that the readout is almost independent of the incident angle of light.

Spectrometers separate wavelengths of light via gratings and can be used to record the spectrum.  The spectrum can then be integrated over the PAR region to produce PPFD.  With knowledge of the spectra, it's also easy to compute other metrics such as irradiance (watts per square meter) by converting photon counts to a power spectrum (Eₚₕₒₜₒₙ = hf = hc/λ) and then integrating over a desired range of wavelengths.  Illuminance (specified in lux) could also be computed by weighing the power spectrum with the luminous efficiency function and integrating over the visual wavelengths.  

Quantum meters are also widely used for field measurements.  These devices have a built in optical filter which lets in only light in the PAR region and rejects light at other wavelengths.  These are straightforward readouts but provide no spectral information. Apogee Instruments makes an excellent device (mainly targeted at researchers and commercial operations) and they are also an excellent source of Photobiology Tutorials and Information.  Hydrofarm has also recently come out with a more economical device but it seems to suffer from reliability issues.
Light measuring tools that are affordable for hobbyists read out lux.  Most are intended for photography, real estate and film making.  These devices operate by measuring power that goes through an optical filter which simulates the luminous efficiency function.  Although these devices don't measure illuminance (measured in lux) instead of PPFD, they can be useful for relative light measurements in some instances (be careful about angles since many are not cosine corrected).  Also, the lux measurements can be converted to PPFD if the spectra is known.  Below, see a table of calibration factors for common grow lights.  Note that there's a very wide number of LED products (covered in more detail in Light Sources) and calibration factors can be all over the place depending on the specific spectra of the diode combination.
Finally, cameras can sometimes be a useful light meter. For example, DSLR have light meters and there are some phone apps which produce lighting results in Lux.  However, these are bound to be much less accurate than a purpose built meter since you are just simulating a power meter by taking pixel values inside optics that are meant for imaging, not measuring power or photons.  Proceed with caution (and please don't email us asking for calibration steps for how to use your iPhone to take light measurements.  I'd need to know the optics and sensor layout and Apple is not going to publish that).

Daily Light Interval

Daily light interval (DLI) specifies the total number of photons incident on a particular point over a given day.  It has units of mols of photons per day per square meter.  Under sunlight, measurements need to be taken throughout the day to take into account the changes in PPFD.  For artificial lighting, the calculation is straightforward: 
DLI requirements vary from species to species.  As a rule of thumb, low light plants require 3-6 mol/m²/day, medium light plants require 6-12 mol/m²/day, and high light plants require 12 mol/m²/day or more.  The interplay between DLI and PPFD varies from species to species.  Some plants may experience no difference in growth as long as the DLI remains constant (for example, if you doubled the PPFD but cut the photoperiod in half).  However, many plants may produce drastically different results.  There's a great number of physiological factors that could come into play which may include photo-activated pathways, metabolic processes, dormancy and flowering cycles.  Also, higher than typical PPFD for a given species can lead to photo-damage from overexposure discussed in Photosynthesis and Lighting.  For more DLI specific commercial species recommendations, see this study by Purdue University.

Grow Light Lifetime

Every grow light has a finite lifetime.  Some technologies will have a lot more longevity than others.  Generally, lifetime is specified in the number of hours it takes for a light source to "lose" brightness below a threshold.  This can be a bulb or some cases a fixture or components of a fixture. 

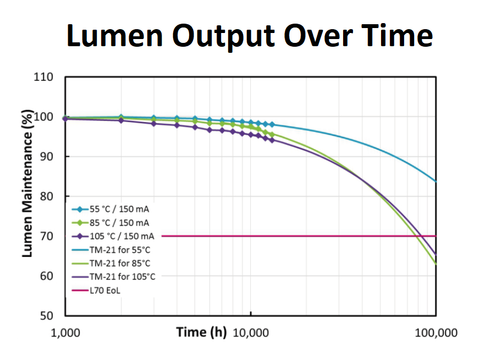
LEDs have a widely accepted test know as the LM-80.  Under this test, the lumen maintenance (output) is measured over time until it falls below a certain threshold.  For example, LT-70 means the number of hours it takes the bulb to fall below 70% of its original lumen output.  For many LED luminaires this translates into tens of thousands of hours.

Other Metrics


There's also a number of metrics that have been used over the years that may be outdated to various degrees or less applicable for horticultural applications.  Examples include foot-candles, CRI, color temperature, etc.  These are covered in our Other Lighting Metrics.

Up next:  Other Lighting Metrics are still used to describe some light sources.

Navigation List

References

Blankenship, Robert E. Molecular Mechanisms of Photosynthesis. Oxford: Blackwell Science, 2002. Print.

Blankenship RE, Tiede DM, Barber J, et al. Comparing photosynthetic and photovoltaic efficiencies and recognizing the potential for improvement. Science. 2011;332(6031):805-809.

Both, A. J. Measuring LED Lighting Systems and Developing Guidelines for Evaluation, Comparison and Use. Rep. SCRI‐LED, 11 June 2013. Web. 12 Feb. 2014.

Bugbee, Bruce. 2020. Apogee Instruments. https://www.apogeeinstruments.com/videos-and-tutorials. (01-01-2020)

Ellison AM, Farnsworth EJ. 2008. Prey availability directly affects physiology, growth, nutrient allocation and scaling relationships among leaf traits in 10 carnivorous plant species. Journal of Ecology 96: 213–221.

Green, M. A., Emery, K., Hishikawa, Y., Warta, W. and Dunlop, E. D. (2014), Solar cell efficiency tables (version 43). Prog. Photovolt: Res. Appl., 22: 1–9.

Johnson, Jakob; Kusuma, Paul; and Bugbee, Bruce, "Efficacy of Two HORTILED Fixtures" (2017). Controlled Environments. Paper 11.

Khan, M. Nisa. Understanding LED Illumination. Boca Raton: CRC, 2014. Print.

Koning, Ross E. 1994. Light. Plant Physiology Information Website. http://plantphys.info/plant_physiology/light.shtml. (8-13-2014)

Koshel, R. John. Illumination Engineering: Design with Nonimaging Optics. Piscataway, NJ: IEEE, 2013. Print.

Kyte, Lydiane, John Kleyn, Holly Scroggins, and Mark Bridgen. Plants From Test Tubes. Portland:Timber Press, 2013. Print.

McCree, K.J. (1972a) Action Spectrum, Absorptance and Quantum Yield of Photosynthesis in Crop Plants. Agricultural Meteorology, 9, 191-216.

McCree, K.J. (1972b) Test of Current Definitions of Photosynthetically Active Radiation against Leaf Photosynthesis Data. Agricultural Meteorology, 10, 443-453.

Mitchell, Cary A., A. J. Both, C. M. Bourget, John F. Burr, Chieri Kubota, Roberto G. Lopez, Robert C. Morrow, and Erik S. Runkle. "LEDs: The Future of Greenhouse Lighting!" Chronica HORTICULTURAE 52.1 (2012): 6-12. Print.

Mitchell, Cary A. Developing LED Lighting Technologies and Practices for Sustainable Specialty-Crop Production. Rep. NIFA SCRI, 15 July 2012. Web. 12 Feb. 2014.

Nelson JA, Bugbee B (2014) Economic Analysis of Greenhouse Lighting: Light Emitting Diodes vs. High Intensity Discharge Fixtures. PLoS ONE 9(6): e99010.

Narukawa, Yukio, et al. “White light emitting diodes with super-high luminous efficacy.” J. Phys. D: Appl. Phys. 43 (2010) 354002 (6pp).

Radetsky, L. C. LED and HID horticultural luminaire testing report. http://www.lrc.rpi.edu/programs/energy/pdf/HorticulturalLightingReport-Final.pdf (2018).

Ross, J. and M. Sulev. 2000. Sources of errors in measurements of PAR. Agricultural and Forest Meteorology 100, 103-125.

Shenzhen Runlite Technology Co., Ltd., “Runlite Epistar,” SMD 5050 Series Data Sheet, Feb. 2014

Singhal, G. S., G. Renger, S.K. Sopory, K.D. Irrgang, and Govindjee. Concepts in Photobiology: Photosynthesis and Photomorphogenesis. Boston: Kluwer Academic, 1999. Print.

Torres, Ariana P., Christopher J. Currey, and Roberto G. Lopez. "Getting The Most Out Of Light Measurements." Greenhouse Grower (2010): 46-54. Issue. 27 Aug. 2010. Web. 14 Feb. 2014.

Wu, Nancy. "High Brightness Led Tube Light Fixtures Bulbs Replacement T8 8ft 2400mm 35W." - Quality LED Tube Light Fixtures for Sale. Shenzhen Greelife Technology Co., Ltd., 2012. Web. 15 July 2014.

Žukauskas, Artūras, Michael Shur, and Remis Gaska. Introduction to Solid-state Lighting. New York: J. Wiley, 2002. Print. 


Get Connected